Comparing 2013 and 2014 Medicare Plan Star Ratings
Medicare Advantage plans and Prescription Drug plans can earn a star rating from one to five stars. A 2-star rating means below average performance and a 5-star rating is considered excellent. Currently, no Medicare plans have a star rating of less than a 2-stars. Medicare uses information from member satisfaction surveys, plans, and health care providers to give overall performance star ratings to Medicare plans. These ratings are an incentive for Medicare plans to improve plan quality by making it easier for beneficiaries to compare and choose plans based on quality and performance.
For plans covering health services, the overall score for quality of those services covers 36 different topics in five categories. For plans covering prescription drug services, the overall score for quality of those services covers 17 different topics in four categories. For plans covering both health and prescription drug services, the overall quality score quality for those services covers all 53 topics in nine categories.
An overall plan rating is then calculated and gives the beneficiary a single summary score that makes it easier to compare plans based on quality and performance. The overall CMS plan rating is included in the optional plan features on our PDP-Finder and MA-Finder tools. Example: California Medicare Prescription Drug Plans. Example: Miami-Dade County, Florida Medicare Advantage Plans..
2013 Medicare Plans:
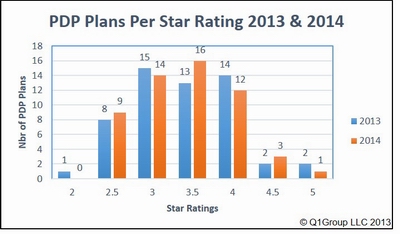
The 2013 Medicare plans, shown in the chart below carried an average star rating of 3.41 for stand-alone Prescription Drug plans (PDPs) and an average star rating of 3.46 for Medicare Advantage plans. The two 2013 5-Star stand-alone Prescription Drug plans were reduced to 4.00 stars for 2014.
*Medicare uses the term plan(s) to mean the contract identifier associated with the plan. In the chart above the total plans is the total number of unique contract id (ex: H1234 or S1234).
**Medicare Advantage plans include all types (Cost, PFFS, HMO, PPO, regional and local). If the same contract was offered with and without prescription drug coverage, it was only counted once.
2014 Medicare Plans:
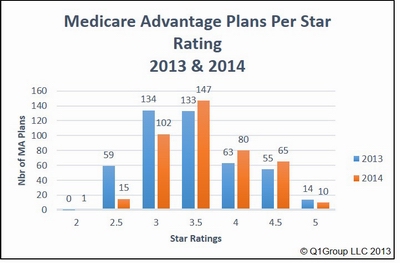
In comparison, the 2014 Medicare plans have an average star rating of 3.40 for stand-alone Prescription Drug plans (PDPs) and an average star rating of 3.66 for Medicare Advantage plans. There is only one 5-Star stand-alone Prescription Drug plan available in 2014 and it is only available to residents of New York. There are 10 Medicare Advantage plans available for 2014 that have earned a 5-Star rating and they are available in 133 counties across the country -- these counties are in CA, CO, DC, FL, HI, IA, MD, NY, OR, TX, VA, WA, WI (To see if 5-star rated Medicare Advantage plans are available in your area, go to MA-Finder.com, enter your ZIP Code and click the 5-star rated plans box. Ex: Bay County, FL).
*Medicare uses the term plan(s) to mean the contract identifier associated with the plan. In the chart above the total plans is the total number of unique contract id (ex: H1234 or S1234).
**Medicare Advantage plans include all types (Cost, PFFS, HMO, PPO, regional and local). If the same contract was offered with and without prescription drug coverage, it was only counted once.
As in 2013, 16% of all rated 2014 stand-alone prescription drug plans have a star rating less than 3.00.
2014 Medicare Advantage plans saw a decrease in the number of plans falling under the 3.00 star rating benchmark. 2013 had 13% of all Medicare Advantage plans under the 3.00 star rating and 2014 shows only 3.8% of all MA plans under 3.00.
The star ratings are increasingly important as Medicare entices plans to increase plan quailty by having the special enrollment period for 5-star plans introduced in the 2012 plan year and the special enrollment period for consistently low performing plans that was intruduced in the 2013 plan year.
The following chart shows the change trend for the plan star ratings from 2013 to 2014. For example, there were a total of 14 plans in 2013 with a 3-star rating. Of those plans, three plans' star rating remained unchanged from 2013 to 2014 (21%) and eight plans had an increase in their star rating (57%) and three plans dropped in plan rating (31%).
You can see from the chart below, that a large percentage of plans from the lower star-rating categories saw an improvement in their quality ratings from 2013 to 2014.
Medicare Advantage plans showed a similar tendancy in star rating changes from 2013 to 2014 -- the lower rated 2013 plans had a tendency toward increasing their star rating as compared to the moderately rated plan. As noted above, this could be due, in part, to the new special enrollment period for consistently low rated plans. See chart below.
For plans covering health services, the overall score for quality of those services covers 36 different topics in five categories. For plans covering prescription drug services, the overall score for quality of those services covers 17 different topics in four categories. For plans covering both health and prescription drug services, the overall quality score quality for those services covers all 53 topics in nine categories.
An overall plan rating is then calculated and gives the beneficiary a single summary score that makes it easier to compare plans based on quality and performance. The overall CMS plan rating is included in the optional plan features on our PDP-Finder and MA-Finder tools. Example: California Medicare Prescription Drug Plans. Example: Miami-Dade County, Florida Medicare Advantage Plans..
2013 Medicare Plans:
The 2013 Medicare plans, shown in the chart below carried an average star rating of 3.41 for stand-alone Prescription Drug plans (PDPs) and an average star rating of 3.46 for Medicare Advantage plans. The two 2013 5-Star stand-alone Prescription Drug plans were reduced to 4.00 stars for 2014.
| 2013 Stand-Alone Prescription Drug Plans - Medicare Star Rating | ||||||||
| Star Rating | 2 | 2.5 | 3 | 3.5 | 4 | 4.5 | 5 | Total Plans* |
| PDPs with rating | 1 | 8 | 15 | 13 | 14 | 2 | 2 | 55 |
| % PDPs with rating | 2% | 15% | 27% | 24% | 25% | 4% | 4% | |
| PDPs with rating lower than 3.0 | 9 | 16% | Average rating for all rated PDP plans | 3.41 | ||||
| Star Rating | 2 | 2.5 | 3 | 3.5 | 4 | 4.5 | 5 | Total Plans* |
| Med. Adv. Plans** with rating | 0 | 59 | 134 | 133 | 63 | 55 | 14 | 458 |
| % MAs** with rating | 0% | 13% | 29% | 29% | 14% | 12% | 3% | |
| Med. Adv. Plans** with rating lower than 3.0 | 59 | 13% | Average rating for all rated Medicare Advantage Plans** |
3.46 | ||||
**Medicare Advantage plans include all types (Cost, PFFS, HMO, PPO, regional and local). If the same contract was offered with and without prescription drug coverage, it was only counted once.
2014 Medicare Plans:
In comparison, the 2014 Medicare plans have an average star rating of 3.40 for stand-alone Prescription Drug plans (PDPs) and an average star rating of 3.66 for Medicare Advantage plans. There is only one 5-Star stand-alone Prescription Drug plan available in 2014 and it is only available to residents of New York. There are 10 Medicare Advantage plans available for 2014 that have earned a 5-Star rating and they are available in 133 counties across the country -- these counties are in CA, CO, DC, FL, HI, IA, MD, NY, OR, TX, VA, WA, WI (To see if 5-star rated Medicare Advantage plans are available in your area, go to MA-Finder.com, enter your ZIP Code and click the 5-star rated plans box. Ex: Bay County, FL).
| 2014 Stand-Alone Prescription Drug Plans - Medicare Star Rating | ||||||||
| Star Rating | 2 | 2.5 | 3 | 3.5 | 4 | 4.5 | 5 | Total Plans* |
| PDPs with rating | 0 | 9 | 14 | 16 | 12 | 3 | 1 | 55 |
| % PDPs with rating | 0% | 16% | 25% | 29% | 22% | 5% | 2% | |
| PDPs with rating lower than 3.0 | 9 | 16% | Average rating for all rated PDP plans | 3.40 | ||||
| Star Rating | 2 | 2.5 | 3 | 3.5 | 4 | 4.5 | 5 | Total Plans* |
| Med. Adv. plans** with rating | 1 | 15 | 102 | 147 | 80 | 65 | 10 | 420 |
| % MAs** with rating | 0.2% | 4% | 24% | 35% | 19% | 15% | 2% | |
| Med. Adv. plans** with rating lower than 3.0 | 16 | 3.8% | Average rating for all rated Medicare Advantage plans** |
3.66 | ||||
**Medicare Advantage plans include all types (Cost, PFFS, HMO, PPO, regional and local). If the same contract was offered with and without prescription drug coverage, it was only counted once.
As in 2013, 16% of all rated 2014 stand-alone prescription drug plans have a star rating less than 3.00.
2014 Medicare Advantage plans saw a decrease in the number of plans falling under the 3.00 star rating benchmark. 2013 had 13% of all Medicare Advantage plans under the 3.00 star rating and 2014 shows only 3.8% of all MA plans under 3.00.
The star ratings are increasingly important as Medicare entices plans to increase plan quailty by having the special enrollment period for 5-star plans introduced in the 2012 plan year and the special enrollment period for consistently low performing plans that was intruduced in the 2013 plan year.
The following chart shows the change trend for the plan star ratings from 2013 to 2014. For example, there were a total of 14 plans in 2013 with a 3-star rating. Of those plans, three plans' star rating remained unchanged from 2013 to 2014 (21%) and eight plans had an increase in their star rating (57%) and three plans dropped in plan rating (31%).
You can see from the chart below, that a large percentage of plans from the lower star-rating categories saw an improvement in their quality ratings from 2013 to 2014.
| Change in 2013 Stand-Alone Prescription Drug Plan Ratings for 2014 | ||||||||
| Plans with a Star Rating Decrease | Plans whose Star Rating Stayed the same | Plans with a Star Rating Increase | Total Nbr Plans (Contract IDs) | |||||
| Stars | Plans | % | Plans | % | Plans | % | ||
| 2013 PDP Plan Rating | 2 | 0 | 0% | 0 | 0% | 1 | 100% | 1 |
| 2.5 | 0 | 0% | 4 | 67% | 2 | 33% | 6 | |
| 3 | 3 | 21% | 3 | 21% | 8 | 57% | 14 | |
| 3.5 | 8 | 53% | 3 | 20% | 4 | 27% | 15 | |
| 4 | 5 | 45% | 3 | 27% | 3 | 27% | 11 | |
| 4.5 | 1 | 50% | 1 | 50% | 0 | 0% | 2 | |
| 5 | 2 | 100% | 0 | 0% | - | - | 2 | |
Medicare Advantage plans showed a similar tendancy in star rating changes from 2013 to 2014 -- the lower rated 2013 plans had a tendency toward increasing their star rating as compared to the moderately rated plan. As noted above, this could be due, in part, to the new special enrollment period for consistently low rated plans. See chart below.
| Change in 2013 Medicare Advantage Plan Ratings for 2014 | ||||||||
| Plans with a Star Rating Decrease | Plans whose Star Rating Stayed the Same | Plans with a Star Rating Increase | Total Nbr Plans (Contract IDs) |
|||||
| 2013 Med. Adv. Plan Rating |
Stars | Plans | % | Plans | % | Plans | % | |
| 2 | 0 | - | 0 | - | 0 | - | 0 | |
| 2.5 | 3 | 6% | 9 | 17% | 40 | 77% | 52 | |
| 3 | 9 | 8% | 55 | 47% | 52 | 45% | 116 | |
| 3.5 | 12 | 10% | 66 | 54% | 44 | 36% | 122 | |
| 4 | 20 | 33% | 26 | 43% | 15 | 25% | 61 | |
| 4.5 | 13 | 24% | 38 | 70% | 3 | 6% | 54 | |
| 5 | 5 | 45% | 6 | 55% | - | - | 11 | |
News Categories
Ask a Pharmacist*
Have questions about your medication?
» Answers to Your Medication Questions, Free!
Available Monday - Friday
8am to 5pm MST
8am to 5pm MST
*A free service included with your no cost drug discount card.
Q1 Quick Links
- Sign-up for our Medicare Part D Newsletter.
- PDP-Facts: 2024 Medicare Part D plan Facts & Figures
- 2024 PDP-Finder: Medicare Part D (Drug Only) Plan Finder
- PDP-Compare: 2023/2024 Medicare Part D plan changes
- 2024 MA-Finder: Medicare Advantage Plan Finder
- MA plan changes 2023 to 2024
- Drug Finder: 2024 Medicare Part D drug search
- Formulary Browser: View any 2024 Medicare plan's drug list
- 2024 Browse Drugs By Letter
- Guide to 2023/2024 Mailings from CMS, Social Security and Plans
- Out-of-Pocket Cost Calculator
- Q1Medicare FAQs: Most Read and Newest Questions & Answers
- Q1Medicare News: Latest Articles
- 2025 Medicare Part D Reminder Service